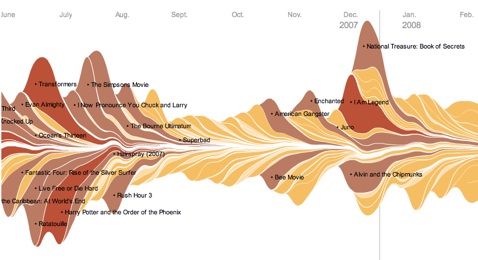
Regular readers will know I love a good graphic so I thought I’d share the above as a cool example of displaying data trends, this example being for US box office. Originally found on Boing Boing.
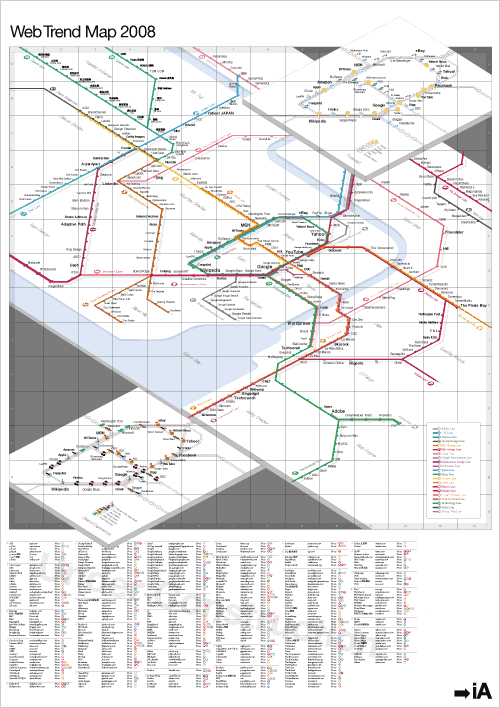
And this web trend map from Tokyo found on Nicola Davies’ blog. Go there where you can find a massive downloadable version.
And if you got ho’s in different area codes…


haha very nice 🙂
http://theillife.com
LikeLike